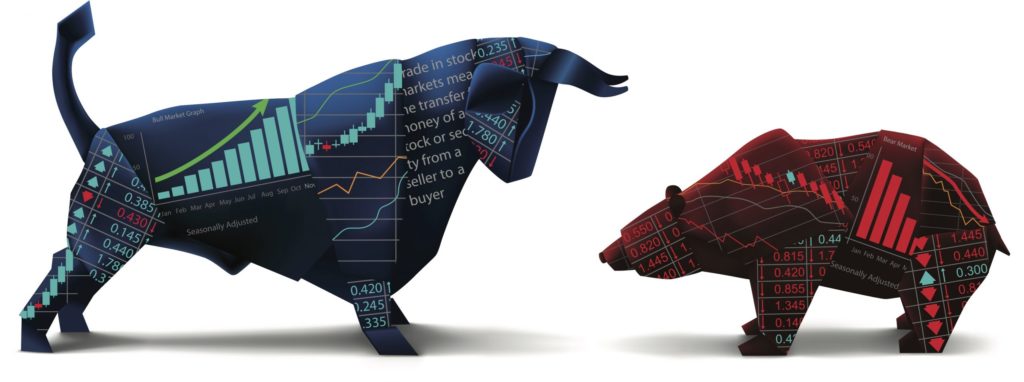
We have just completed the final quarter, not only of the year, but also the decade, so it’s as good a time as any to reflect back on the market behavior for the past year, and also for the past 10 years. The short version is that we have experienced a bull market for the entire ten-year period, with no -20% bear market periods and only a few 10% corrections since June 2009. People who record the history of the markets will remember that the investors of the 2010s participated in the longest bull market in American history – a totally improbable event considering that the decade came right after one of the most dramatic market setbacks in modern times.
Also worth noting is how the predictors of doom were once again totally off-base. When the Federal Reserve Board stepped in to stem the worst of the Great Recession, there were widespread cries that the Fed was “printing money” in a way that would lead to massive inflation and/or the bursting of a stock market bubble. Today, an expansionist Fed is routinely criticized for being too tight, rather than too loose. Inflation, meanwhile, has ranged from 0.7% to 2.1% – which hardly signals a crisis. If you’ve noticed any bubble-bursting in the equities markets, please help us find it.
By any measure, 2019 was a remarkable year for investors – and who could have guessed? Stocks went on sale in December 2018, and many were predicting that the bearish trend would continue through calendar 2019. But investors who took advantage of the lower prices or stayed the course saw well-above-average gains almost literally across the board. The markets went on sale again in August when there were reports of a very slight inversion of the yield curve in the bond markets which (it was widely reported) signaled that a recession was on the near horizon. Those rumors turned out to be false and the yield curve–that is, the difference in bond rates between short-term and long-term issues–had subsequently steepened.

A breakdown shows that just about every investment asset was up strongly in 2019. The Wilshire 5000 Total Market Index — the broadest measure of U.S. stocks — gained 9.08% in the 4th quarter, finishing the year with a hefty 31.02% gain. The comparable Russell 3000 index was up 25.52% for the year, and has gained an average of 11.83% for the decade of the 2010s.
Looking at large cap stocks, the Wilshire U.S. Large Cap index gained 9.09% in the fourth quarter, providing a 31.51% return for the year. The Russell 1000 large-cap index finished the year with a similar 31.43% gain (averaging a 13.54% gain over the last 10-year period), while the widely-quoted S&P 500 index of large company stocks gained 8.53% during the year’s final quarter and overall finished up 28.88% in calendar 2019 – narrowly losing out to the decade’s best yearly gain of 29.6% in 2017. Over the last ten years, investors in the S&P 500 saw annualized gains of 11.22% in the value of their holdings.
Meanwhile, the Russell Midcap Index finished the 2019 calendar year up 30.54%, averaging 13.19% a year for the decade.
As measured by the Wilshire U.S. Small-Cap index, investors in smaller companies posted 9.01% gains in the final quarter, to end the year with a 26.21% return. The comparable Russell 2000 Small-Cap Index posted a 25.52% gain in 2019.
Even the foreign markets were generous to investors this year. The broad-based EAFE index of companies in developed foreign economies gained 7.81% in the final quarter, and ended the year up 18.44% in dollar terms. However, the past ten years have not been the best times to invest in international stocks; the index recorded an annualized gain of just 2.57% over that time period. In aggregate, European stocks were up 20.03% in 2019, while EAFE’s Far East Index gained 15.46%. Emerging market stocks of less developed countries, as represented by the EAFE EM index, were up 11.36% in dollar terms in the fourth quarter, giving these very small components of most investment portfolios a 15.42% gain for the year. However, their 10-year track record is not enviable: up just 1.20% a year for the decade.
Looking over the other investment categories, real estate, as measured by the Wilshire U.S. REIT index, posted a 1.14% loss during the year’s final quarter, but it finished the year with a 25.76% gain. The S&P GSCI index, which measures commodities returns, gained 8.31% in the 4th quarter, to finish the year up 17.63%. Looking back, however, commodities returns dramatically lagged U.S. stocks over the past decade: the total return for the commodities index overall was a negative 5.44%.
In the bond markets, coupon rates on 10-year Treasury bonds dropped almost a full percentage point, year-on-year, to stand at 1.75% at year end. Similarly, 30-year government bond yields have fallen from 3.01% at the beginning of the year to 2.38% coupon rates today. Five-year municipal bonds are yielding, on average, a meager 1.14% a year, while 30-year munis are yielding 2.15% on average.
It’s hard to overstate how unusual this long bull market has been in investing history. Bear markets tend to occur about every 3.5 years, and the previous record was 9.5 years from November 1990 to March of 2000. However, we still have a ways to go to match the 418% that was achieved in the 1990s.
Longer-term, it is certain that we will experience a recession, but no person alive can predict the hour or the day. Most economists are reluctant to predict an economic downturn when unemployment is at record lows and the slow-growth economy is chugging along with a 2.3% gain in 2019. 2020 might see a recession or at least a slowdown in growth if there is another trade conflict with China, and a shift toward rising interest rates could drive up the cost of debt servicing for corporations that are highly leveraged. Nobody knows where the Presidential impeachment process will go from here.
At the same time, dramatic increases in domestic oil production has lessened the possibility that the economy will experience an energy recession, and healthcare cost increases have moderated over the course of the decade.
Similarly, nobody can predict when or how the bull market will end, how deep the coming recession or bear market will be, or, really, anything other than the fact that all past downturns were followed by upturns which took the markets and the economy to new heights.
We love hearing from you! Please don’t hesitate to call or email if we can help you, 865-240-2292.

